Note
This documentation applies to Legacy BloodHound and is no longer maintained.
See up-to-date documentation for BloodHound CE here: BloodHound Support
The BloodHound GUI
The BloodHound GUI is where the vast majority of your data analysis will happen. Our primary objectives in designing the BloodHound GUI are intuitive design and operational focus. In other words, we want you to get access to the data you need as easily and quickly as possible.
Authentication
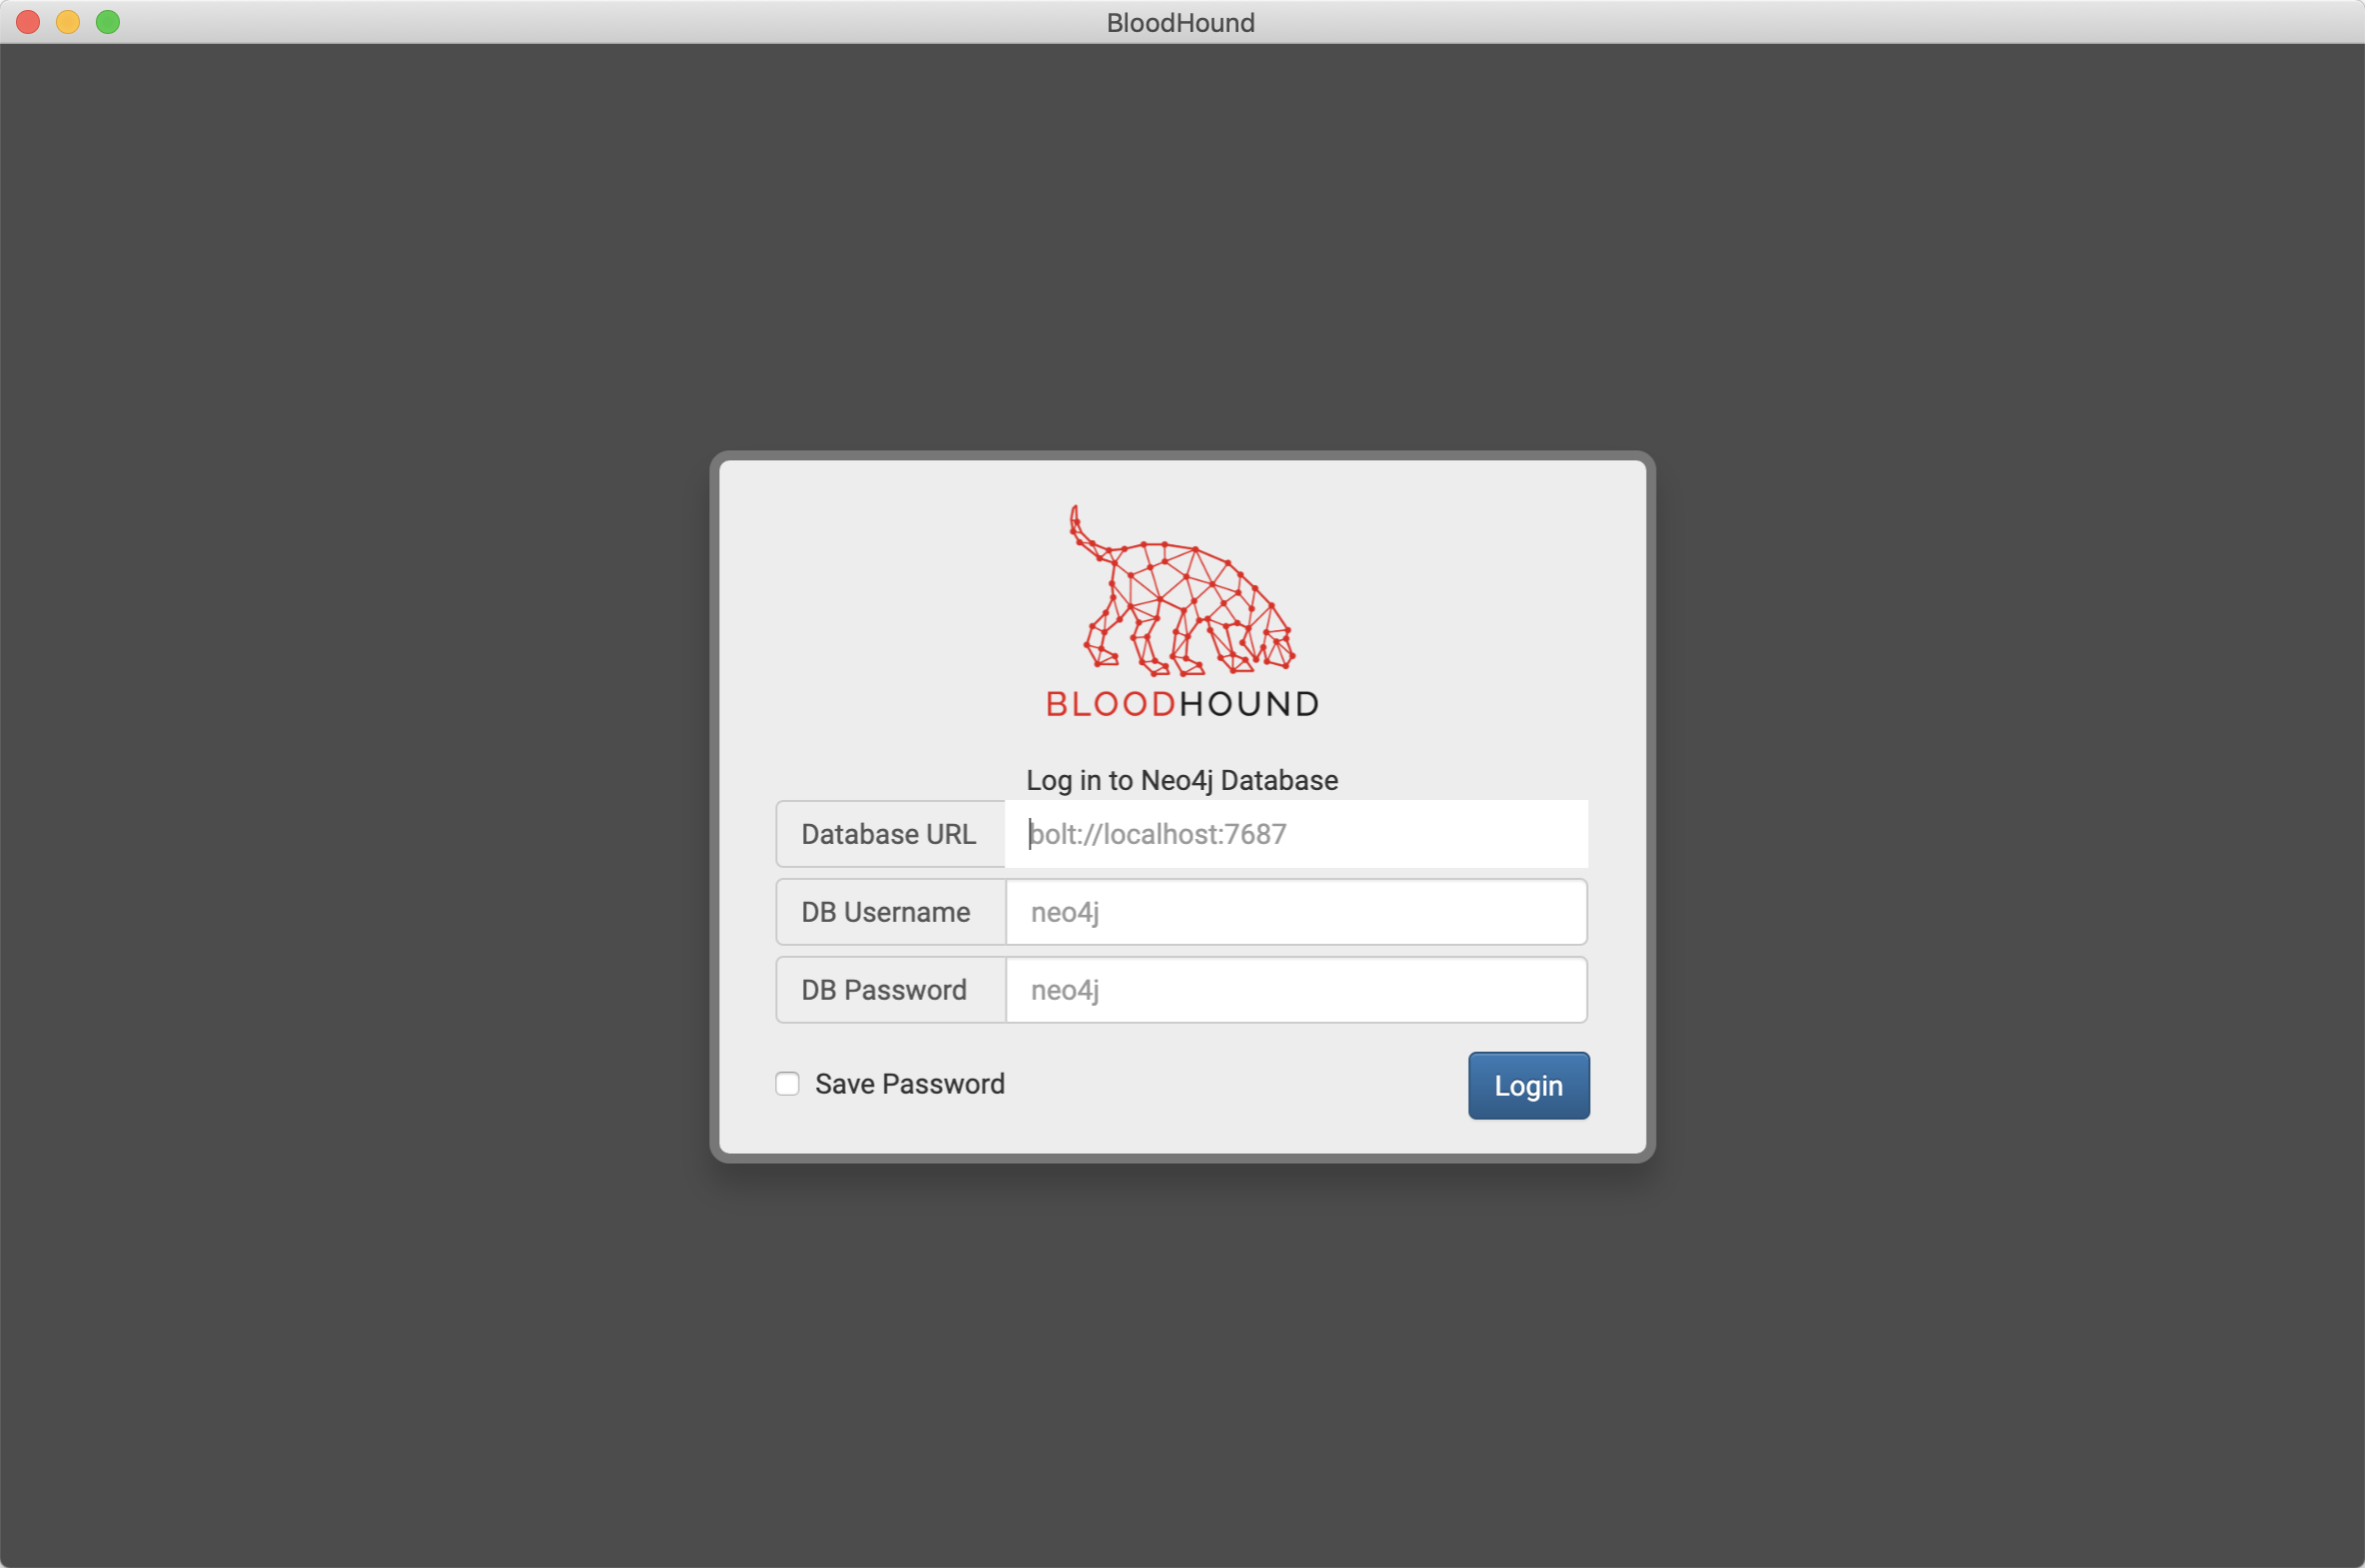
When you open the BloodHound GUI for the first time, you will see an authentication prompt:
Note
Want to follow along? Connect to the example hosted database:
- DBurl: bolt://206.189.85.93:7687
- DBusername: neo4j
- DBpassword: BloodHound
The “Database URL” is the IP address and port where your neo4j database is running, and should be formatted as bolt://ip:7687/
The DB Username is the username for the neo4j database. The default username for a neo4j database is neo4j.
The DB Password is the password for the neo4j database. The default password for a neo4j database is neo4j. The password for the example database is BloodHound.
Click “Login”, and the GUI will attempt to authenticate to neo4j with the information you provided.
You can optionally click “Save Password” to automatically log in next time with the same info.
After successful authentication, the BloodHound GUI will do three things:
- First, the GUI will perform a cypher query to ensure the graph schema has the appropriate indices and constraints. These operations prevent duplicate node creation and greatly speed up node lookup
- Second, the GUI will collect stats about the database and display those stats in the “Database Info” tab.
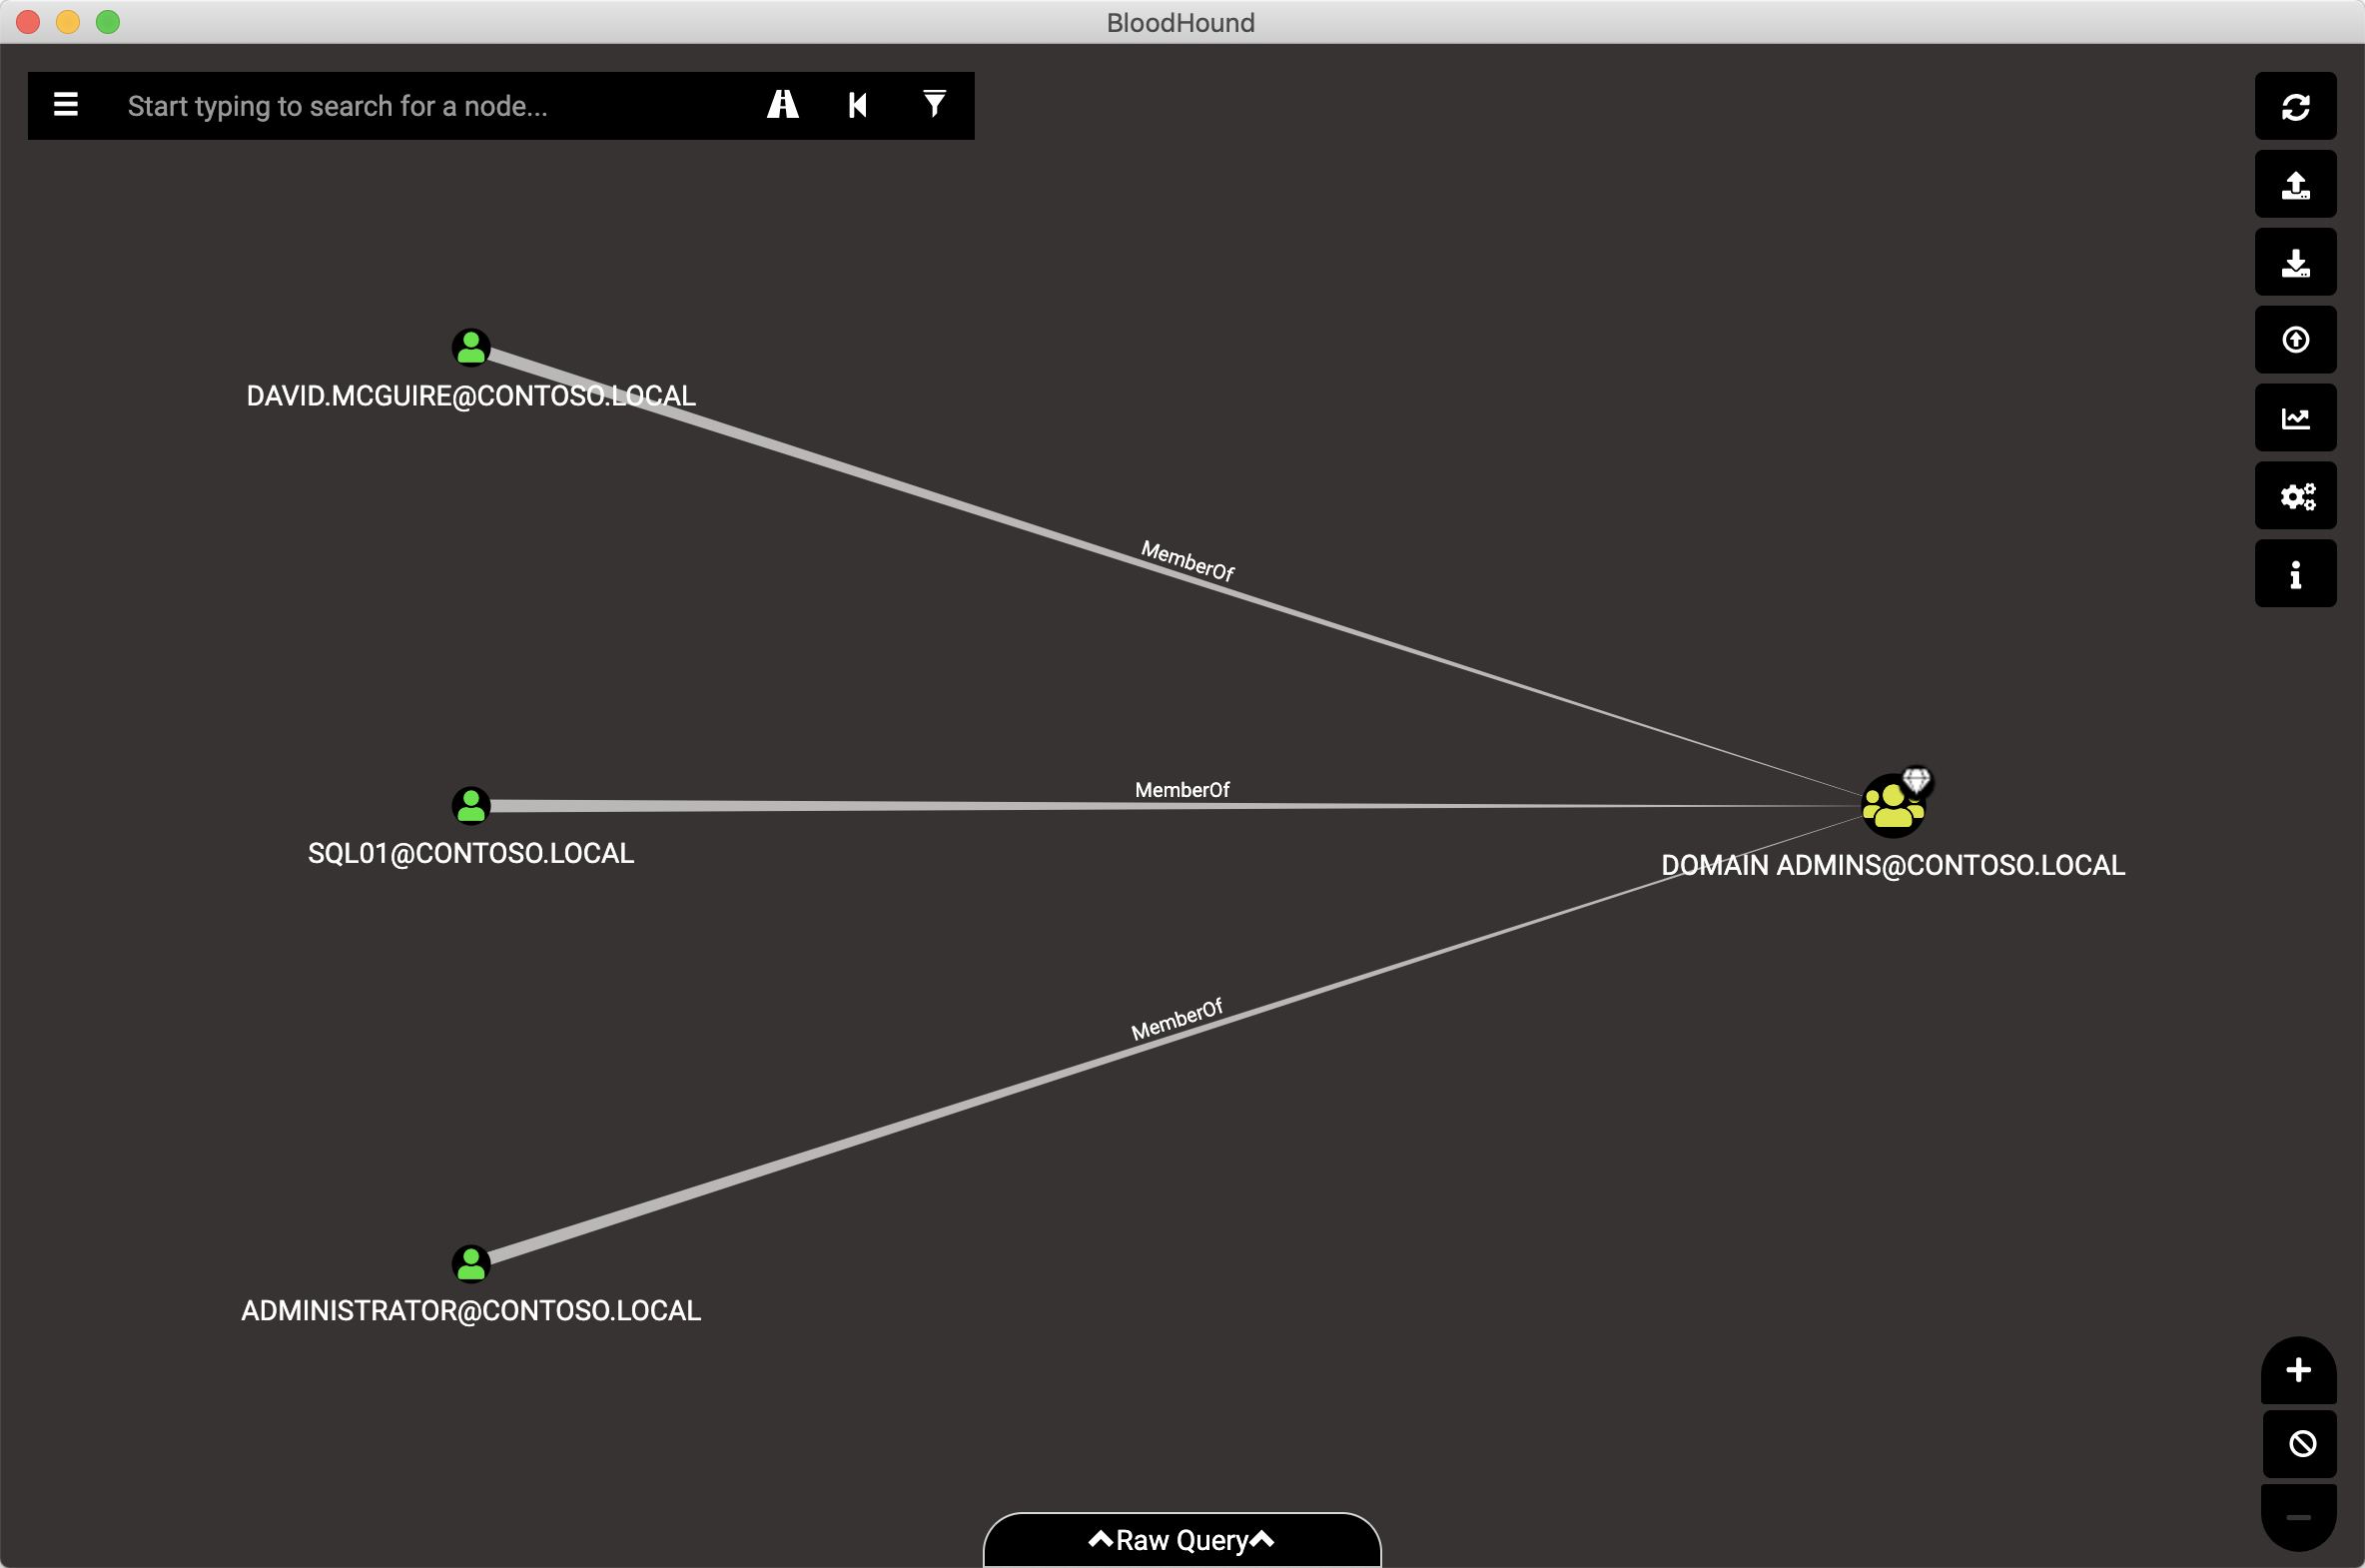
- Finally, the GUI will query for all users that belong to any Domain Admins group, then display those users and show how they belong to the Domain Admins group.
Upon successful logon, BloodHound will draw any group(s) with the “Domain Admins” in their name, and show you the effective users that belong to the group(s):
GUI Elements
Graph Drawing Area
As much of the screen real estate as possible is dedicated to the graph rendering area - where BloodHound displays nodes and the relationships between them. You can move nodes around, highlight paths by mousing over a node involved in a path, and click on nodes to see more information about those nodes. You can also right click nodes and perform several actions against those nodes:
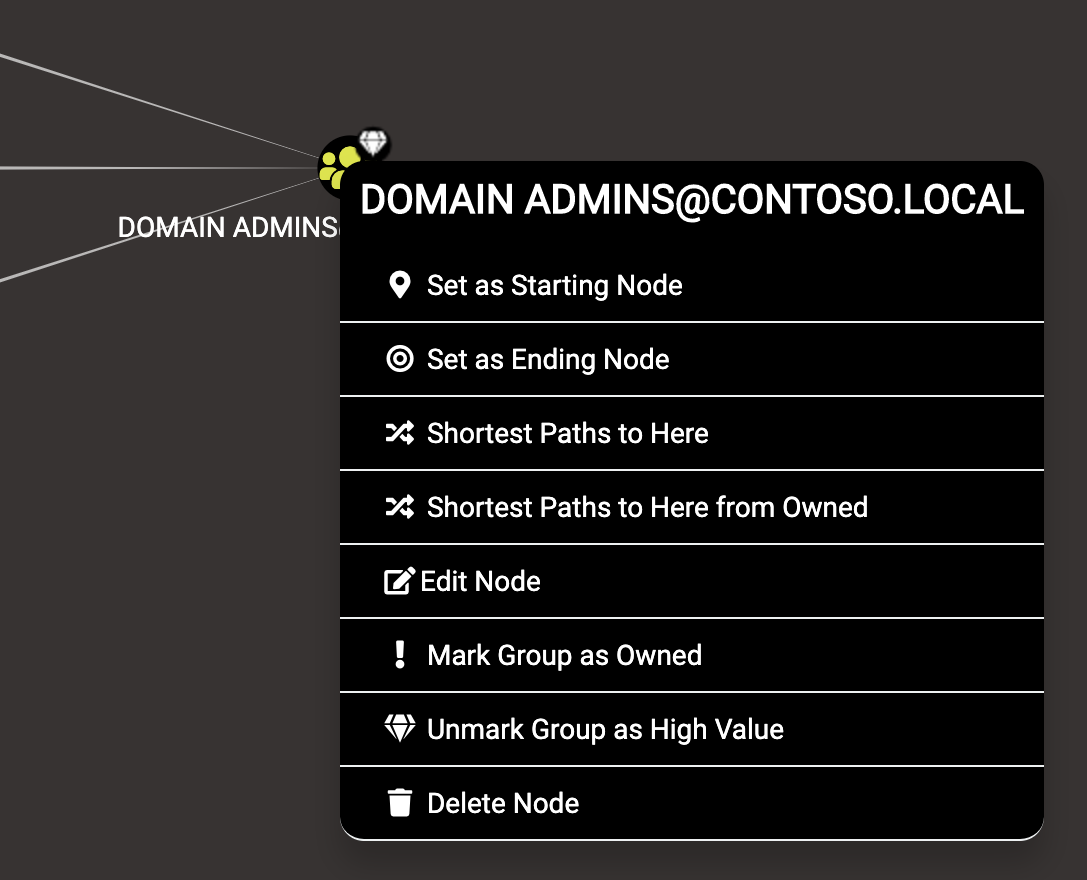
- Set as Starting Node: Set this node as the starting point in the pathfinding tool. Click this and you will see this node’s name in the search bar, then you can select another node to target after clicking the pathfinding button.
- Set as Ending Node: Set this node as the target node in the pathfinding tool.
- Shortest Paths to Here: This will perform a query to find all shortest paths from any arbitrary node in the database to this node. This may cause a very long query time in neo4j and an even longer render time in the BloodHound GUI.
- Shortest Paths to Here from Owned: Find attack paths to this node from any node you have marked as owned.
- Edit Node: This brings up the node editing modal, where you can edit current properties on the node or even add your own custom properties to the node.
- Mark Group as Owned: This will internally set the node as owned in the neo4j database, which you can then use in conjunction with other queries such as “Shortest paths to here from Owned”
- Mark/Unmark Group as High Value: Some nodes are marked as “high value” by default, such as the domain admins group and enterprise admin group. This can then be used with other queries such as “shortest paths to high value assets”
- Delete Node: Deletes the node from the neo4j database
You can also right click edges, then click “help” to see information about any particular attack primitive:
Finally, there are four keyboard shortcuts when the graph rendering area has focus:
- CTRL: Pressing CTRL will cycle through the three different node label display settings - default, always show, always hide.
- Spacebar: Pressing spacebar will bring up the spotlight window, which lists all nodes that are currently drawn. Click an item in the list and the GUI will zoom into and briefly highlight that node.
- Backspace: Pressing backspace will go back to the previous graph result rendering. This is the same functionality as clicking the Back button in the search bar.
- S: Pressing the letter s will toggle the expansion or collapse of the information panel below the search bar. This is the same functionality as clicking the More Info button in the search bar.
Search Bar
In the top left of the GUI is the search bar. Start typing the name of a node, and the GUI will automatically recommend nodes that match what you’ve typed so far. Click one of the suggestions, and the GUI will render that node:
You can also constrain your search to particular node types by prepending your search with the appropriate node label. For example, you can search for just groups with the word “Admin” in them with this search:
group:Admin
You can prepend your search with the following node types:
Active Directory
- Group
- Domain
- Computer
- User
- OU
- GPO
- Container
Azure
- AZApp
- AZRole
- AZDevice
- AZGroup
- AZKeyVault
- AZManagementGroup
- AZResourceGroup
- AZServicePrincipal
- AZSubscription
- AZTenant
- AZUser
- AZVM
Pathfinding
One of the most powerful features of BloodHound is its ability to find attack paths between two given nodes, if an attack path exists. Within the search bar is the “pathfinding” button, which brings down a second text box where you can type in the name of a node you want to target.
For example, if we wanted to find a path from the “Domain Users” group to the “Domain Admins” group, we can use the path finding feature like this:
Depending on your opsec requirements or other factors, you may want to find attack paths that do not include particular attack primitives, such as AD object manipulation. Click the filter icon to bring up the edge filtering pane, and select or de-select the particular edges or class of edges as needed:
Raw Query Bar
With query debug mode enabled, any time the BloodHound GUI performs a cypher query where the results are shown in the graph rendering area, the cypher query itself will appear here. This can be helpful for learning cypher:

Additionally, you can execute your own cypher queries using the raw query bar. Your cypher query must return either paths or nodes, the BloodHound GUI cannot render list output. For example, to return all “user” type nodes in the database: